2025 IMD
It's out, finally!
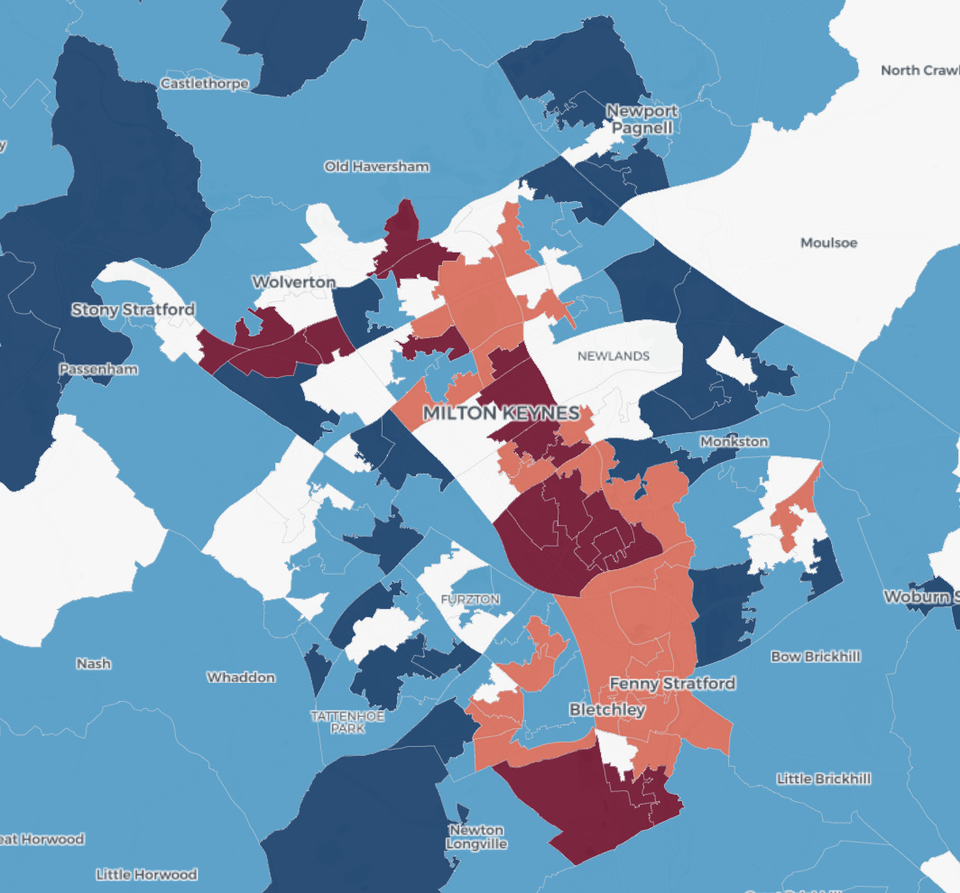
With the 2025 Index of Multiple Deprivation finally out, I decided to map the long term changes in the domains from 2010-2025. To do this, I had to convert the 2021 LSOAs to 2011 LSOAs. I achieved this using Random Forest regressions, achieving largely high R Squared values (except for environment...this is harder to track through census variables).
The main trends are Reform-y areas are becoming more deprived, and Green-y areas are becoming less deprived. Labour-y areas are basically the same. Cities are doing better since 2010, with the notable exception of Covid, and rural areas are falling behind.
Anyway, I thought you might be interested!