UK Elections - Results By Deprivation
2010-2024 UK Election Results by Deprivation
UK Election Results by Deprivation
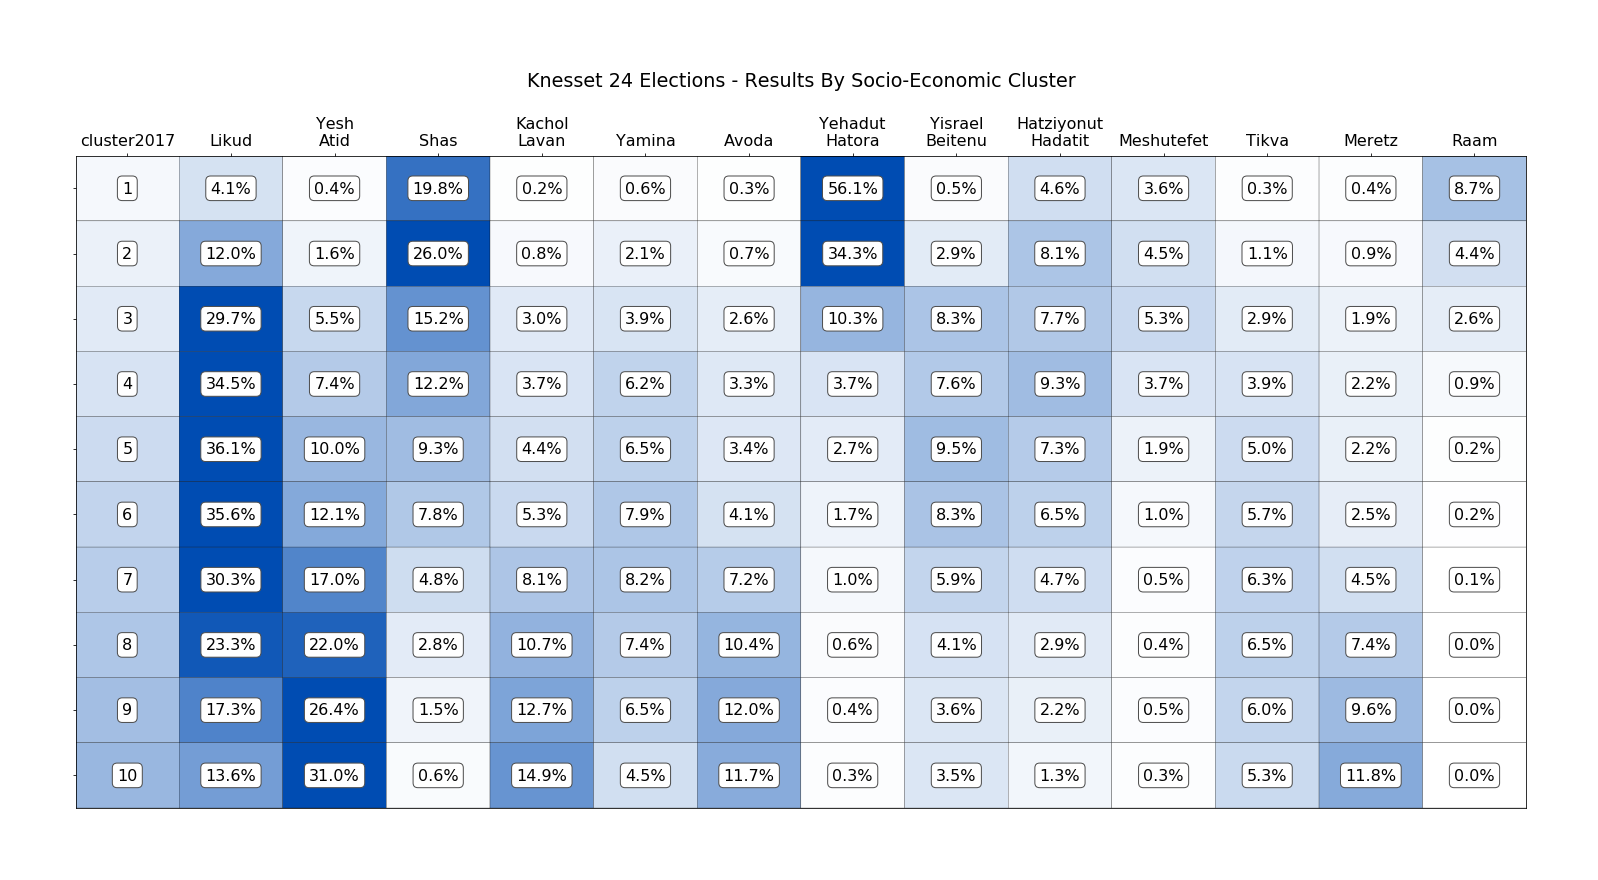
Based on this chart of the Israeli elections, I was inspired to make the same for the UK. Thank you Chris Terry for the help!
This involved getting a harmonised IMD measure of deprivation, provided by MySociety, and the election results from 2010 to 2019, provided by the UK Parliament. Below is the result:
The main findings are that Conservatives do better in less deprived areas, Labour hold up stronger in more deprived areas, but with shifting coalitions from election to election. NI is particularly deprived, so it's parties do best with most deprived voters. The SNP has a broad electorate across deprivation deciles.
The source code, as ever, is on GitHub.


.svg)